Python Code
Output
Example Code Snippets
Here are some example code snippets to get you started with Python Matplotlib:
Simple Bar Plot
import matplotlib.pyplot as plt

# Example Data (if using Pandas)
import pandas as pd
import numpy as np

data = pd.DataFrame({
    'species': ['Adelie', 'Chinstrap', 'Gentoo', 'Adelie', 'Chinstrap', 'Gentoo'],
    'flipper_length_mm': [181, 195, 210, 190, 200, 215]
})

# Grouping Data by Species and Getting Mean Flipper Length
species_avg = data.groupby('species')['flipper_length_mm'].mean()

# Plot
plt.bar(species_avg.index, species_avg.values)
plt.xlabel('Species')
plt.ylabel('Average Flipper Length (mm)')
plt.title('Penguin Flipper Length by Species')
plt.show()
Filtering
import matplotlib.pyplot as plt

# Example Data (if using Pandas)
import pandas as pd
import numpy as np

data = pd.DataFrame({
    'island': ['Biscoe','Dream','Biscoe','Biscoe','Biscoe'],
    'body_mass_g': [5200.0, 3000.0, 3175.0, 3175.0, 3175.0],
    'sex': ['female','male','female','female',np.nan]
})


print(f'Initial table:\n{data}\n' + '-'*30)

data = data.dropna()  # Drops rows where at least one value is NaN
data = data.drop_duplicates()  # Removes duplicate rows
print(f'After dropna+drop_duplicates:\n{data}\n' + '-'*30)

score = data['body_mass_g'] - data['body_mass_g'].mean()
print(f'Init Scores:\n{score}\n' + '-'*30)

score = np.abs(score)
print(f'After abs:\n{score}\n' + '-'*30)

data = data[score < np.std(data['body_mass_g'])]

print(f'filtered data:\n{data}\n' + '-'*30)


data_female = data[data['sex'] == 'female']
print(f'data_female:\n{data_female}\n' + '-'*30)

print(f'len(data_female)={len(data_female)}')
Filtering details
The filtering process in the above code snippet involves the following steps:
- Drop rows with at least one NaN value using
dropna(). - Remove duplicate rows using
drop_duplicates(). - Calculate the score as the difference between the body mass and the mean body mass.
- Take the absolute value of the score using
np.abs(). - Filter the data based on the condition that the score is less than the standard deviation of the body mass:
data[score < np.std(data['body_mass_g'])].
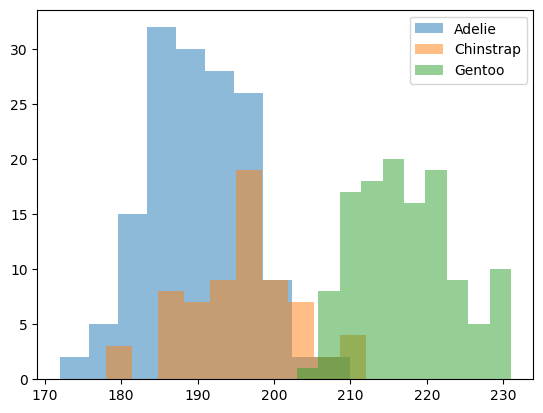
`plt.hist` Example
import pandas as pd
csv = """
species,island,bill_length_mm,bill_depth_mm,flipper_length_mm,body_mass_g,sex
Adelie,Torgersen,39.1,18.7,181,3750,MALE
Adelie,Torgersen,34.4,18.4,184,3325,FEMALE
Adelie,Torgersen,46,21.5,194,4200,MALE
Adelie,Biscoe,37.8,18.3,174,3400,FEMALE
Chinstrap,Dream,50.5,18.4,200,3400,FEMALE
Chinstrap,Dream,49.5,19,200,3800,MALE
Chinstrap,Dream,46.4,17.8,191,3700,FEMALE
Chinstrap,Dream,42.5,16.7,187,3350,FEMALE
Gentoo,Biscoe,45.5,13.7,214,4650,FEMALE
Gentoo,Biscoe,48.4,14.6,213,5850,MALE
Gentoo,Biscoe,45.3,13.8,208,4200,FEMALE
Gentoo,Biscoe,46.2,14.9,221,5300,MALE
"""
# Convert string to file-like object
csv_io = io.StringIO(csv)
# Read the CSV
data = pd.read_csv(csv_io)
# Display first 5 rows
print(data.head(5))
import matplotlib.pyplot as plt
groupd = data.groupby('species')
for species, species_data in groupd:
plt.hist(species_data['flipper_length_mm'], label=species, alpha=0.5)
plt.legend()
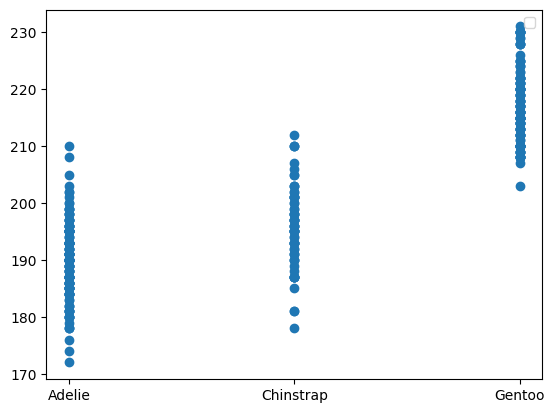
plt.show()Scatter Plot Example
import pandas as pd

csv = """
species,island,bill_length_mm,bill_depth_mm,flipper_length_mm,body_mass_g,sex
Adelie,Torgersen,39.1,18.7,181,3750,MALE
Adelie,Torgersen,34.4,18.4,184,3325,FEMALE
Adelie,Torgersen,46,21.5,194,4200,MALE
Adelie,Biscoe,37.8,18.3,174,3400,FEMALE
Chinstrap,Dream,50.5,18.4,200,3400,FEMALE
Chinstrap,Dream,49.5,19,200,3800,MALE
Chinstrap,Dream,46.4,17.8,191,3700,FEMALE
Chinstrap,Dream,42.5,16.7,187,3350,FEMALE
Gentoo,Biscoe,45.5,13.7,214,4650,FEMALE
Gentoo,Biscoe,48.4,14.6,213,5850,MALE
Gentoo,Biscoe,45.3,13.8,208,4200,FEMALE
Gentoo,Biscoe,46.2,14.9,221,5300,MALE
"""


# Convert string to file-like object
csv_io = io.StringIO(csv)

# Read the CSV
data = pd.read_csv(csv_io)

# Display first 5 rows
print(data.head(5))

import matplotlib.pyplot as plt

groupd = data.groupby('species')

print(groupd)


plt.scatter(data['species'], data['flipper_length_mm'])

plt.legend()
plt.show()
Note that `plt.scatter(data['species'], data['flipper_length_mm'])` creates a scatter plot with the species on the x-axis and the flipper length on the y-axis.